


Summary:
- Research is an important – and sometimes essential – component of matching to any specialty
- Publications such as abstracts, research articles, or presentations are used to assess one’s suitability for a specialty career.
- The most competitive specialties require the most research
- MD-PhDs have a modest advantage in matching in any given specialty. It’s unclear whether this advantage is due to the degree itself or to the fact MD-PhDs typically have more time to devote to research
- Other non-PhD degrees such as MPHs and MBAs may not offer clear benefits in terms of matching and could even be considered a disadvantage in some fields
Table of Contents
How Many Publications for Residency: Specialty Averages
Trying to figure out how many publications you need for residency applications? Based on the 2024 Charting Outcomes in the Match reports, we can see the average number of abstracts, presentations, and publications for matched US seniors for each specialty.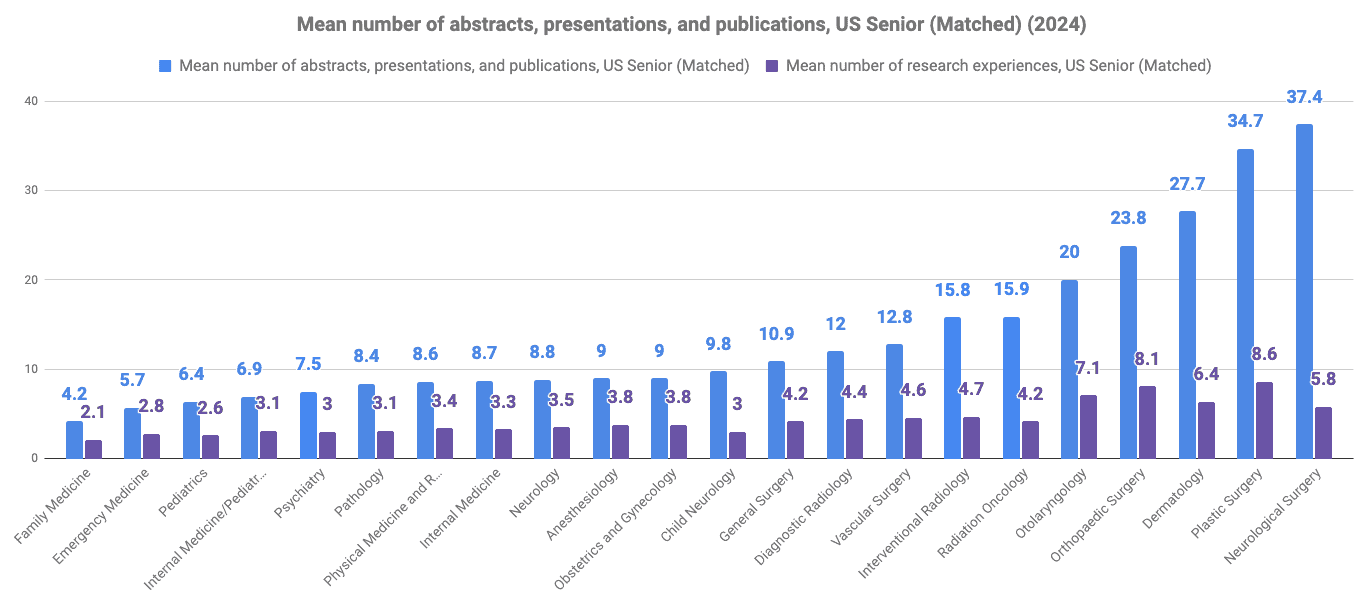 Here is the same data in a table:
| Specialty | Mean number of abstracts, presentations, and publications, US Senior (Matched) | Mean number of abstracts, presentations, and publications, US Senior (Unmatched) | Percentage who have Ph.D. degree, US Senior (Matched) | Percentage who have Ph.D. degree, US Senior (Unmatched) | Mean number of research experiences, US Senior (Matched) | Mean number of research experiences, US Senior (Unmatched) |
|---|---|---|---|---|---|---|
| Family Medicine | 4.2 | 1.4 | 0.9 | 0 | 2.1 | 1.8 |
| Emergency Medicine | 5.7 | 5 | 1 | 5 | 2.8 | 2.3 |
| Pediatrics | 6.4 | 21.5 | 3.1 | 50 | 2.6 | 0.5 |
| Internal Medicine/Pediatrics | 6.9 | 6.2 | 1.8 | 4.5 | 3.1 | 2.6 |
| Psychiatry | 7.5 | 4.6 | 4.8 | 2.7 | 3 | 3.1 |
| Pathology | 8.4 | 4.1 | 21.4 | 0 | 3.1 | 2.3 |
| Physical Medicine and Rehabilitation | 8.6 | 6.4 | 1.9 | 0 | 3.4 | 3.3 |
| Internal Medicine | 8.7 | 6.2 | 5 | 4.8 | 3.3 | 3.3 |
| Neurology | 8.8 | 5.5 | 4.7 | 3.6 | 3.5 | 2.8 |
| Anesthesiology | 9 | 5.4 | 3.8 | 1.6 | 3.8 | 3.1 |
| Obstetrics and Gynecology | 9 | 6.8 | 1.4 | 4.3 | 3.8 | 3.3 |
| Child Neurology | 9.8 | 1 | 13.4 | 0 | 3 | 2 |
| General Surgery | 10.9 | 7.3 | 1.8 | 1.2 | 4.2 | 3.7 |
| Diagnostic Radiology | 12 | 8 | 3.5 | 2.6 | 4.4 | 3.6 |
| Vascular Surgery | 12.8 | 8 | 1.7 | 20 | 4.6 | 4.5 |
| Interventional Radiology | 15.8 | 10.1 | 2.8 | 0 | 4.7 | 4.6 |
| Radiation Oncology | 15.9 | 13.5 | 14.4 | 100 | 4.2 | 2 |
| Otolaryngology | 20 | 15.6 | 2.8 | 4.1 | 7.1 | 5.5 |
| Orthopaedic Surgery | 23.8 | 18 | 1.3 | 3.2 | 8.1 | 8 |
| Dermatology | 27.7 | 19 | 9.8 | 1.7 | 6.4 | 4.9 |
| Plastic Surgery | 34.7 | 26.3 | 3.4 | 2.1 | 8.6 | 9.2 |
| Neurological Surgery | 37.4 | 31.8 | 6.8 | 7.9 | 5.8 | 5.5 |
How Many Publications for Competitive Residencies?
The answer depends on the specialty you’re aiming for. Some of the most competitive specialties such as neurological surgery, plastic surgery, and dermatology expect a significant amount of publications. For example, applicants to neurosurgery had an average of 37 publications, presentations, and abstracts in the 2024 Match. Here’s a quick look at the specialties with the highest average number of publications in 2024- Neurological surgery (37.4 abstracts, presentations, and publications on average)
- Plastic surgery (34.7)
- Dermatology (27.7)
- Orthopaedic surgery 23.8)
- Otolaryngology (20)
What Counts as a Publication for Residency?
Note that the figures for “publications” for residency include much more. Specifically, you’ll have the chance to add things like presentations (oral or poster), case reports, and even abstracts. Thus, even students who fear they don’t have any research may have more than they think. Here is a non-exhaustive list of what counts as a “publication” for residency application purposes:- Published peer-reviewed journal articles
- Submitted/accepted journal articles that haven’t yet hit print
- Book chapters you authored/co-authored
- Presentations (oral/poster)
- Case reports
What Counts as Research Experience for Residency?
You’ll note in the above figure that those matched in more competitive specialties tend to have more research experiences. While this is true, technically, any research you’ve ever done – including as an undergraduate or even a high schooler – counts as research experience for residency. Note that when you include these experiences, it will be fair game to discuss on your residency applications and interviews. On your ERAS residency application, you’ll be asked the following questions:- Experience Type: Research
- Organization: ______ Lab
- Position: (e.g., medical student researcher)
- Supervisor (if applicable): Dr. __________
- Location: (Country), (State), (City)
- Average hours/week: ________
- Description: (your description of your research, highlighting your contributions and how it fits into your overall “story”)
- Reason for leaving: (still working in lab vs. _______)
How Many Publications for Residency: Does an MD/PhD Help?
When considering the question of how many publications for residency, more is generally better. This is particularly true in the most competitive specialties. Given that, does having a PhD help even more? Here is the data for the % of matched applicants who had a PhD degree in the 2024 Match.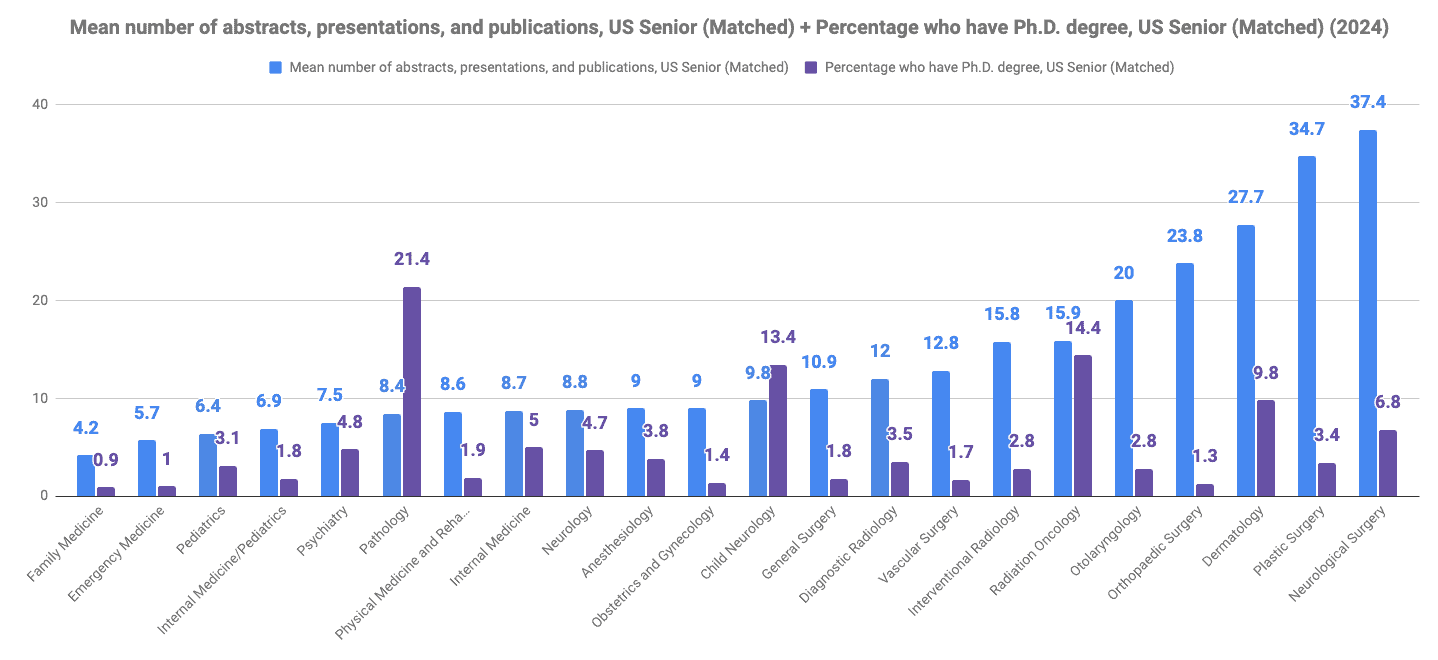
Seeing the percentage of matched applicants with PhDs may make you wonder if a PhD is necessary to match in certain fields.
PhD Match Rate Shows MD/PhDs May Have a Moderate Advantage
Instead, if we graph the match rate for PhDs vs. those without PhDs, a different story emerges. Specifically, we can see that all else being equal, there is perhaps a slight to moderate advantage to PhD applicants. Note, though, that there is a clear advantage to having more research. Since MD/PhD programs allow for extra dedicated time to do research, it’s not obvious why PhDs have an advantage. Do the extra letters after their name help? Or is it just the extra time – and extra time to publish – that matters the most?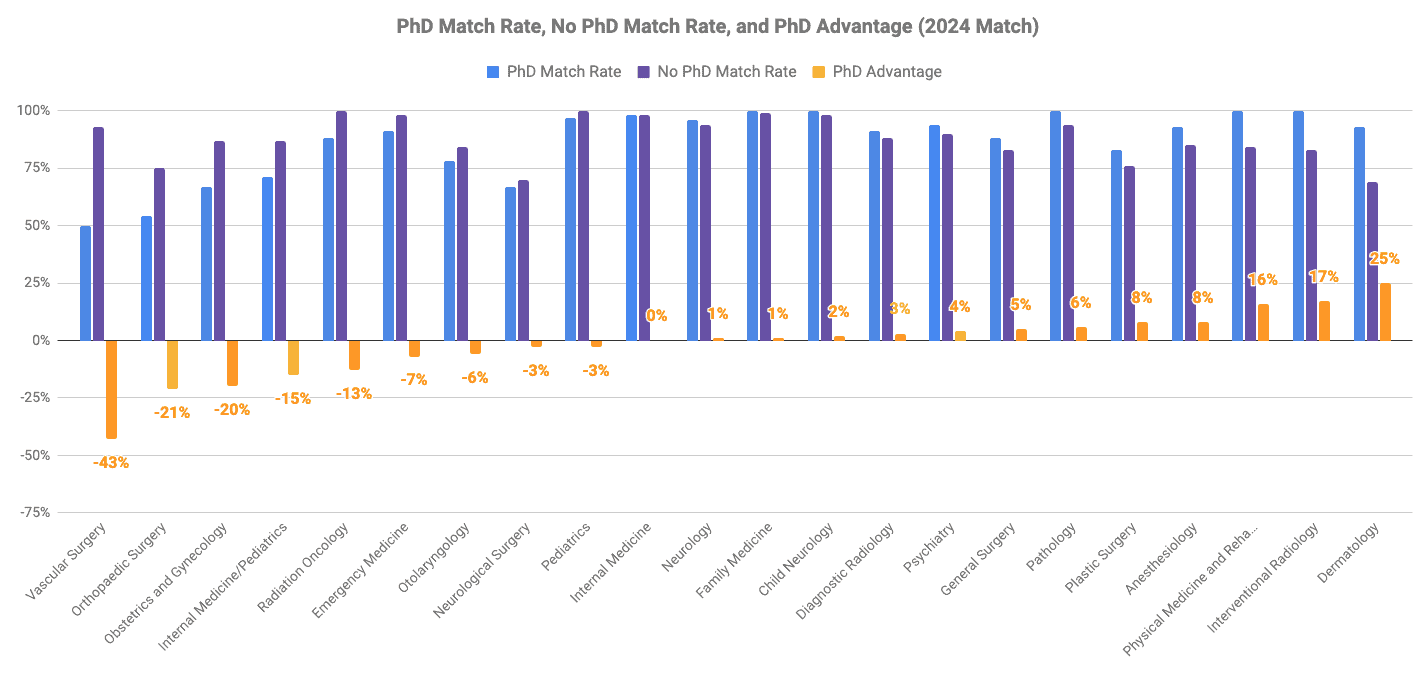
Having a PhD has a modest effect at most on whether people match into a given specialty.
| Specialty | PhD Match Rate | No PhD Match Rate | PhD Advantage | PhD Degree (Matched) | PhD Degree (Unmatched) | No PhD Degree (Matched) | No PhD Degree (Unmatched) |
|---|---|---|---|---|---|---|---|
| All applicants | 92% | 90% | 2% | 499 | 43 | 12881 | 1350 |
| Vascular Surgery | 50% | 93% | -43% | 1 | 1 | 57 | 4 |
| Orthopaedic Surgery | 54% | 75% | -21% | 7 | 6 | 539 | 184 |
| Obstetrics and Gynecology | 67% | 87% | -20% | 12 | 6 | 867 | 134 |
| Internal Medicine/Pediatrics | 71% | 87% | -15% | 5 | 2 | 272 | 42 |
| Radiation Oncology | 88% | 100% | -13% | 14 | 2 | 83 | 0 |
| Emergency Medicine | 91% | 98% | -7% | 10 | 1 | 976 | 19 |
| Otolaryngology | 78% | 84% | -6% | 7 | 2 | 241 | 47 |
| Neurological Surgery | 67% | 70% | -3% | 10 | 5 | 136 | 58 |
| Pediatrics | 97% | 100% | -3% | 36 | 1 | 1113 | 1 |
| Internal Medicine | 98% | 98% | 0% | 142 | 3 | 2699 | 60 |
| Neurology | 96% | 94% | 1% | 22 | 1 | 444 | 27 |
| Family Medicine | 100% | 99% | 1% | 10 | 0 | 1114 | 12 |
| Child Neurology | 100% | 98% | 2% | 15 | 0 | 97 | 2 |
| Diagnostic Radiology | 91% | 88% | 3% | 21 | 2 | 577 | 76 |
| Psychiatry | 94% | 90% | 4% | 47 | 3 | 941 | 108 |
| General Surgery | 88% | 83% | 5% | 15 | 2 | 797 | 160 |
| Pathology | 100% | 94% | 6% | 44 | 0 | 162 | 10 |
| Plastic Surgery | 83% | 76% | 8% | 5 | 1 | 142 | 46 |
| Anesthesiology | 93% | 85% | 8% | 41 | 3 | 1049 | 182 |
| Physical Medicine and Rehabilitation | 100% | 84% | 16% | 4 | 0 | 212 | 40 |
| Interventional Radiology | 100% | 83% | 17% | 3 | 0 | 106 | 21 |
| Dermatology | 93% | 69% | 25% | 28 | 2 | 257 | 117 |
Correlation ≠ Causation; PhDs Have More Time for Research
Again, let’s be clear. There appears to be a modest advantage to having a PhD for residency applications. However, it’s not clear whether this advantage is due to the PhD degree itself or simply the fact that PhDs generally have more publications. (Or something else entirely!). We can conclude relatively confidently that having research is beneficial to residency applications, regardless of whether one has a PhD or not.How Long Are MD/PhD Programs?
So, how long does an MD/PhD program typically take to complete? Generally, MD/PhD programs take eight years to complete—four years for the medical degree and four years for the PhD. The exact amount of time will depend on the individual student and their research topic. However, this completion time is highly variable. While the medical degree usually takes 3-4 years, the doctoral component varies widely based on the individual and his/her research topic. Some students may complete their doctoral program in two years, while others may take up to eight. In addition to researching their chosen topic in the laboratory, students must complete the necessary degree requirements, such as coursework, a thesis, and a qualifying exam. These may add extra time to the overall completion of the program.How Much Do MD/PhDs Make?
Are you curious about the earning potential of MD-PhDs? Generally, physician salaries depend on their specialty, practice setting, and experience – not just their degrees. MD-PhDs may be more likely to pursue research-based careers, which typically offer lower salaries than those in a clinical setting, particularly in private practice. So, the answer to the question “How much do MD/PhDs make?” ultimately depends on these factors. However, MD-PhDs are highly sought-after for their unique skillset and academic background, often offering professional opportunities such as teaching and research roles with the potential for rewarding work.Does Having an MPH or MBA Help With Matching?
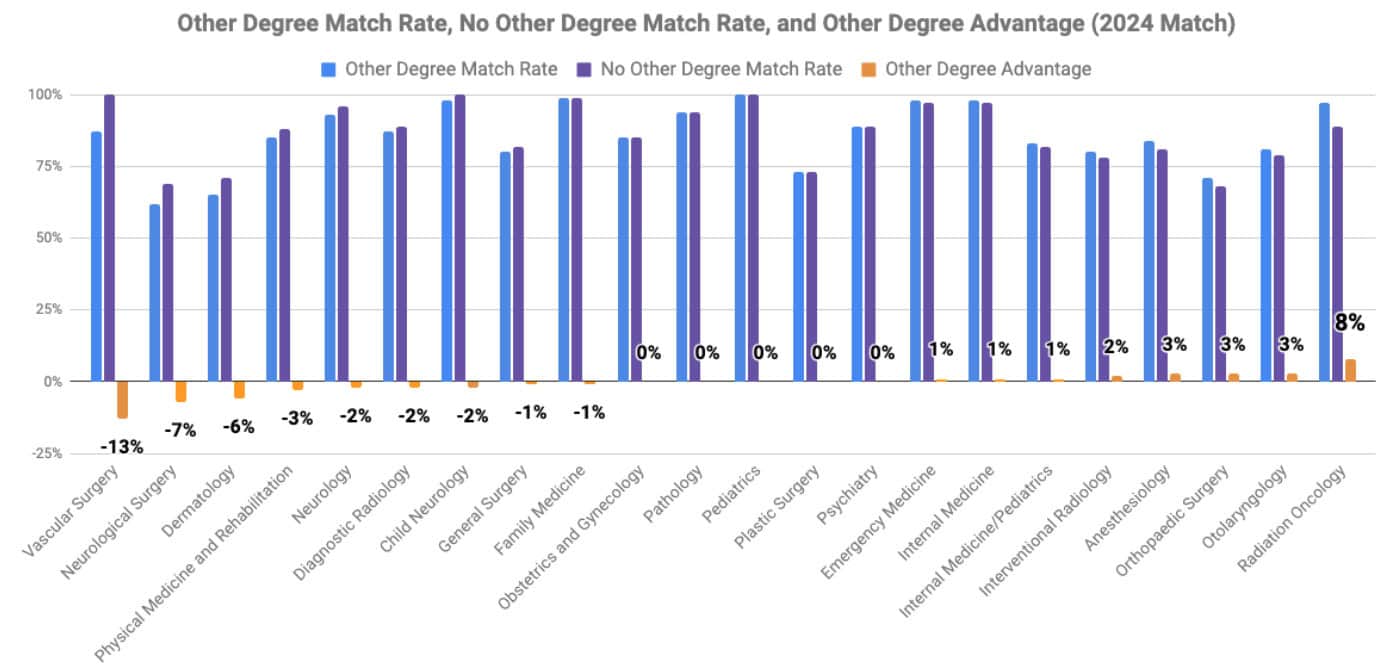 Another question you may wonder is does an MPH help for residency applications? Here is the match rate for US seniors with other degrees (including MPH’s), and those without.
Here is the same data in a table:
Another question you may wonder is does an MPH help for residency applications? Here is the match rate for US seniors with other degrees (including MPH’s), and those without.
Here is the same data in a table:
| Specialty | Other Degree Match Rate | No Other Degree Match Rate | Other Degree Advantage | Other Graduate Degree (Matched) | Other Graduate Degree (Unmatched) | No Other Graduate Degree (Matched) | No Other Graduate Degree (Unmatched) |
|---|---|---|---|---|---|---|---|
| Pediatrics | 100% | 100% | 0% | 867 | 1 | 192 | 0 |
| Family Medicine | 99% | 99% | -1% | 872 | 10 | 191 | 1 |
| Child Neurology | 98% | 100% | -2% | 80 | 2 | 23 | 0 |
| Internal Medicine | 98% | 97% | 1% | 2061 | 50 | 538 | 17 |
| Emergency Medicine | 98% | 97% | 1% | 772 | 17 | 196 | 7 |
| Radiation Oncology | 97% | 89% | 8% | 68 | 2 | 16 | 2 |
| Pathology | 94% | 94% | 0% | 144 | 10 | 29 | 2 |
| Neurology | 93% | 96% | -2% | 357 | 25 | 91 | 4 |
| Psychiatry | 89% | 89% | 0% | 731 | 91 | 202 | 26 |
| Diagnostic Radiology | 87% | 89% | -2% | 438 | 66 | 114 | 14 |
| Vascular Surgery | 87% | 100% | -13% | 40 | 6 | 11 | 0 |
| Obstetrics and Gynecology | 85% | 85% | 0% | 661 | 115 | 194 | 35 |
| Physical Medicine and Rehabilitation | 85% | 88% | -3% | 180 | 32 | 35 | 5 |
| Anesthesiology | 84% | 81% | 3% | 760 | 145 | 188 | 45 |
| Internal Medicine/Pediatrics | 83% | 82% | 1% | 188 | 38 | 69 | 15 |
| Otolaryngology | 81% | 79% | 3% | 170 | 39 | 44 | 12 |
| General Surgery | 80% | 82% | -1% | 620 | 151 | 176 | 39 |
| Interventional Radiology | 80% | 78% | 2% | 80 | 20 | 25 | 7 |
| Plastic Surgery | 73% | 73% | 0% | 88 | 33 | 35 | 13 |
| Orthopaedic Surgery | 71% | 68% | 3% | 393 | 161 | 100 | 47 |
| Dermatology | 65% | 71% | -6% | 183 | 97 | 49 | 20 |
| Neurological Surgery | 62% | 69% | -7% | 87 | 53 | 38 | 17 |
Why an MPH or MBA Might Hurt Your Chances in the Competitive Specialties
Looking through the specialty-level data, a pattern emerges. In fact, competitive specialties are among the specialties with the greatest apparent disadvantage for other degree holders. If true, why would an MPH or other degree hurt your chances for matching? The biannual program director survey may have some clues. Recently released in 2024, it addresses what factors they used to interview and rank applicants to their programs. Here are the results:| Characteristics Considered in Deciding Whom to Interview | Percentage of Respondents Endorsing | Mean Importance Rating |
|---|---|---|
| USMLE Step 1 pass | 90% | 4.5 |
| Medical Student Performance Evaluation (MSPE/Dean's Letter) | 85% | 4.1 |
| Letters of recommendation in the specialty | 84% | 4.2 |
| USMLE Step 2 Clinical Knowledge (CK) score | 83% | 4.2 |
| Personal Statement | 81% | 4 |
| Any failed attempt in USMLE | 77% | 4.4 |
| History of having overcome significant obstacles | 74% | 4.1 |
| Perceived commitment to specialty | 72% | 4.4 |
| Diversity characteristics | 72% | 4 |
| Leadership qualities | 72% | 4.2 |
| Grades in required clerkships | 70% | 4 |
| Class ranking/quartile | 66% | 3.9 |
| Evidence of professionalism and ethics | 66% | 4.5 |
| Receipt of preference (program) signal | 63% | 4.1 |
| COMLEX-USA Level 1 pass | 62% | 4.5 |
| Any failed attempt in COMLEX-USA | 62% | 4.4 |
| Volunteer/extracurricular experiences | 61% | 3.9 |
| Geographic preferences | 60% | 3.9 |
| Other life experience | 60% | 4 |
| Grades in clerkship in desired specialty | 60% | 4.2 |
| Audition elective/rotation within your department | 60% | 4.2 |
| Personal prior knowledge of the applicant | 58% | 4.2 |
| COMLEX-USA Level 2 Clinical Evaluation (CE) score | 56% | 4.2 |
| Consistency of grades | 50% | 4 |
| Awards or special honors in clinical clerkships | 48% | 3.6 |
| Gold Humanism Honor Society (GHHS) membership | 48% | 3.6 |
| Evidence of continuous medical education without gaps | 43% | 3.9 |
| Alpha Omega Alpha (AOA) membership | 43% | 3.5 |
| Demonstrated involvement and interest in research | 42% | 3.7 |
| Awards or special honors in clerkship in desired specialty | 39% | 3.8 |
| Accreditation status of applicant's medical school | 37% | 4.2 |
| Passing USMLE Step 2 Clinical Skills (CS) | 36% | 4.2 |
| Ability to work legally in the U.S. without a visa | 35% | 4.2 |
| Visa status | 33% | 3.9 |
| Graduate of highly-regarded medical or osteopathic school | 31% | 3.5 |
| Fluency in language spoken by your patient population | 30% | 3.7 |
| Away rotation in your specialty at another institution | 26% | 3.8 |
| Passing COMLEX-USA Level 2 Performance Evaluation | 25% | 4.2 |
| Applicant was flagged with Match violation by the NRMP | 23% | 4.8 |
| Sigma Sigma Phi (osteopathic honor society) membership | 21% | 3.5 |
| Interest in academic career | 19% | 3.7 |
| Awards or special honors in basic sciences | 18% | 3.1 |
| USMLE Step 3 score | 13% | 3.4 |
| COMLEX-USA Level 3 score | 10% | 3.4 |
| How applicant's medical school handled virtual rotations | 5% | 3.3 |


Is this not impossible?? I cannot imagine doing that much research on top of medical school; furthermore, wouldn’t doing 20+ publications in three years encourage low quality research? I genuinely do not know how a medical student would be able to accomplish all of that considering how long of a process research can take, clinical or otherwise. Please give advice on how to achieve this!