
What are the most competitive US medical specialties? What are the least competitive specialties? In this article, we’ll dive into just how competitive each of the specialties in the NRMP match is. You’ll learn how strong you must be to get into each specialty.
Note: Updated with new data for 2025: This article now includes the latest insights from the 2024 Main Residency Match and the Program Director Survey
Summary:
- We can estimate the “competitiveness” of each NRMP specialty by looking at unmatched % and median USMLE scores for US seniors
- We derive three broad tiers of competitiveness
- Brutally Competitive (e.g., neurological surgery, dermatology)
- Competitive (e.g., anesthesiology, diagnostic radiology)
- Less Competitive (e.g., family medicine, pediatrics)
- Unsurprisingly, competitiveness correlates strongly with lifestyle, particularly estimated hourly salary
- No matter the specialty, the most desirable residency spots will always be difficult to attain
Table of Contents
What is the NRMP Match?
The National Resident Matching Program (NRMP) is called “The Match.” This program determines the fate of most aspiring residents in the United States.
Not Every Specialty is in the NRMP Match
For this article, we will discuss residencies and not fellowships. In other words, we won’t discuss subspecialties of general surgery like surgical oncology or thoracic surgery. Instead, we will focus on residencies.
Note that not every residency specialty participates in the NRMP Match. One notable alternative is the SF Match, ophthalmology, and plastic surgery residencies. The other major exception that comes to mind is urology, which has its own Urology Residency Match Program (i.e., the “Urology Match”).
This article will only discuss the residencies participating in the NRMP Match.
Which Residencies in the NRMP Match Are Most Competitive in 2024?
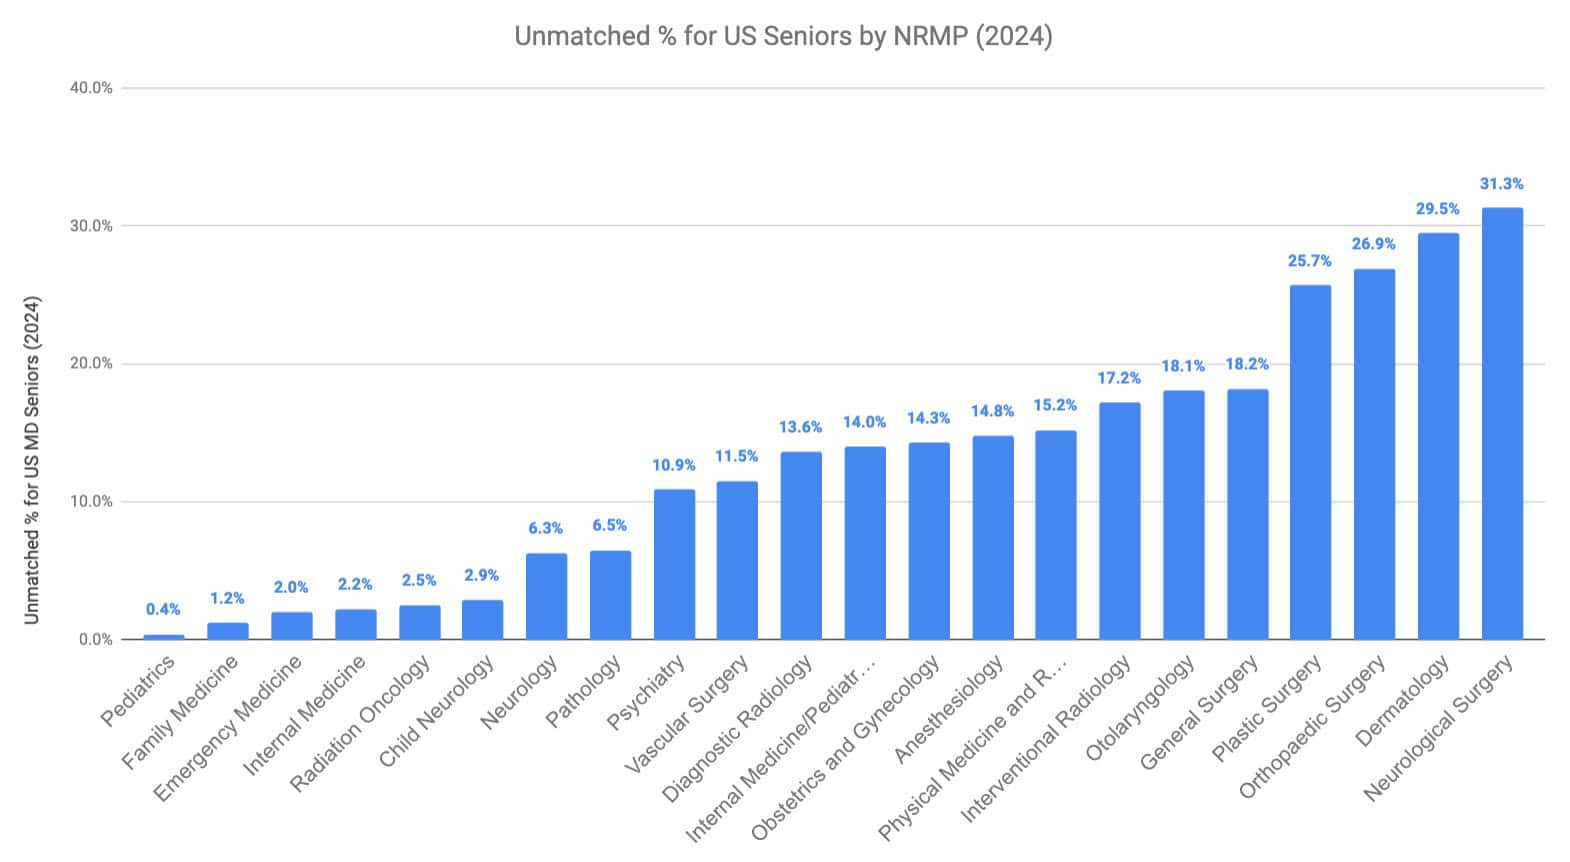
So which residencies in the 2024 NRMP Match were the most competitive? To calculate this, let’s examine which specialties had the highest unmatched % for US seniors. The unmatched % would be the total number of people who did not match in their given specialty of those who applied. US Seniors are graduating from US allopathic (MD) schools in the year of the Match. They are also the group with the highest match rate – higher than US graduates, US osteopathic seniors, US IMGs, and non-US IMGs.
See this article for a primer on the different kinds of group classifications.
So, which NRMP specialty was the most competitive in 2024, according to the unmatched % of US Seniors?
| Unmatched % US Seniors (2022) | Match Rate US Seniors (2022) | Total Positions Offered | Total # ALL Applicants | Total US MD Senior Applicants | US Senior Matched | US Senior Unmatched | |
|---|---|---|---|---|---|---|---|
| Pediatrics | 0.4% | 99.6% | 3,139 | 2,904 | 1,442 | 1,438 | 6 |
| Family Medicine | 1.2% | 98.8% | 5,213 | 4,702 | 1,444 | 1,427 | 17 |
| Emergency Medicine | 2.0% | 98.0% | 3,026 | 2,980 | 1,272 | 1,246 | 26 |
| Internal Medicine | 2.2% | 97.8% | 10,681 | 13,143 | 3,782 | 3,699 | 83 |
| Radiation Oncology | 2.5% | 97.5% | 203 | 201 | 122 | 119 | 3 |
| Child Neurology | 2.9% | 97.1% | 212 | 211 | 138 | 134 | 4 |
| Neurology | 6.3% | 93.7% | 1,126 | 1,476 | 640 | 600 | 40 |
| Pathology | 6.5% | 93.5% | 628 | 942 | 275 | 257 | 18 |
| Psychiatry | 10.9% | 89.1% | 2,261 | 2,859 | 1,463 | 1,304 | 159 |
| Vascular Surgery | 11.5% | 88.5% | 100 | 139 | 87 | 77 | 10 |
| Diagnostic Radiology | 13.6% | 86.4% | 1,186 | 1,566 | 899 | 777 | 122 |
| Internal Medicine/Pediatrics | 14.0% | 86.0% | 390 | 488 | 392 | 337 | 55 |
| Obstetrics and Gynecology | 14.3% | 85.7% | 1,539 | 2,034 | 1,284 | 1,100 | 184 |
| Anesthesiology | 14.8% | 85.2% | 2,135 | 2,933 | 1,628 | 1,387 | 241 |
| Physical Medicine and Rehabilitation | 15.2% | 84.8% | 577 | 740 | 343 | 291 | 52 |
| Interventional Radiology | 17.2% | 82.8% | 190 | 256 | 174 | 144 | 30 |
| General Surgery | 18.1% | 81.9% | 1,717 | 2,529 | 1,257 | 1,028 | 229 |
| Otolaryngology | 18.2% | 81.8% | 382 | 496 | 414 | 339 | 75 |
| Plastic Surgery | 25.7% | 74.3% | 213 | 350 | 253 | 188 | 65 |
| Orthopaedic Surgery | 26.9% | 73.1% | 916 | 1,448 | 993 | 726 | 267 |
| Dermatology | 29.5% | 70.5% | 576 | 916 | 601 | 424 | 177 |
| Neurological Surgery | 31.3% | 68.7% | 241 | 414 | 297 | 204 | 93 |
We can graph the same data.
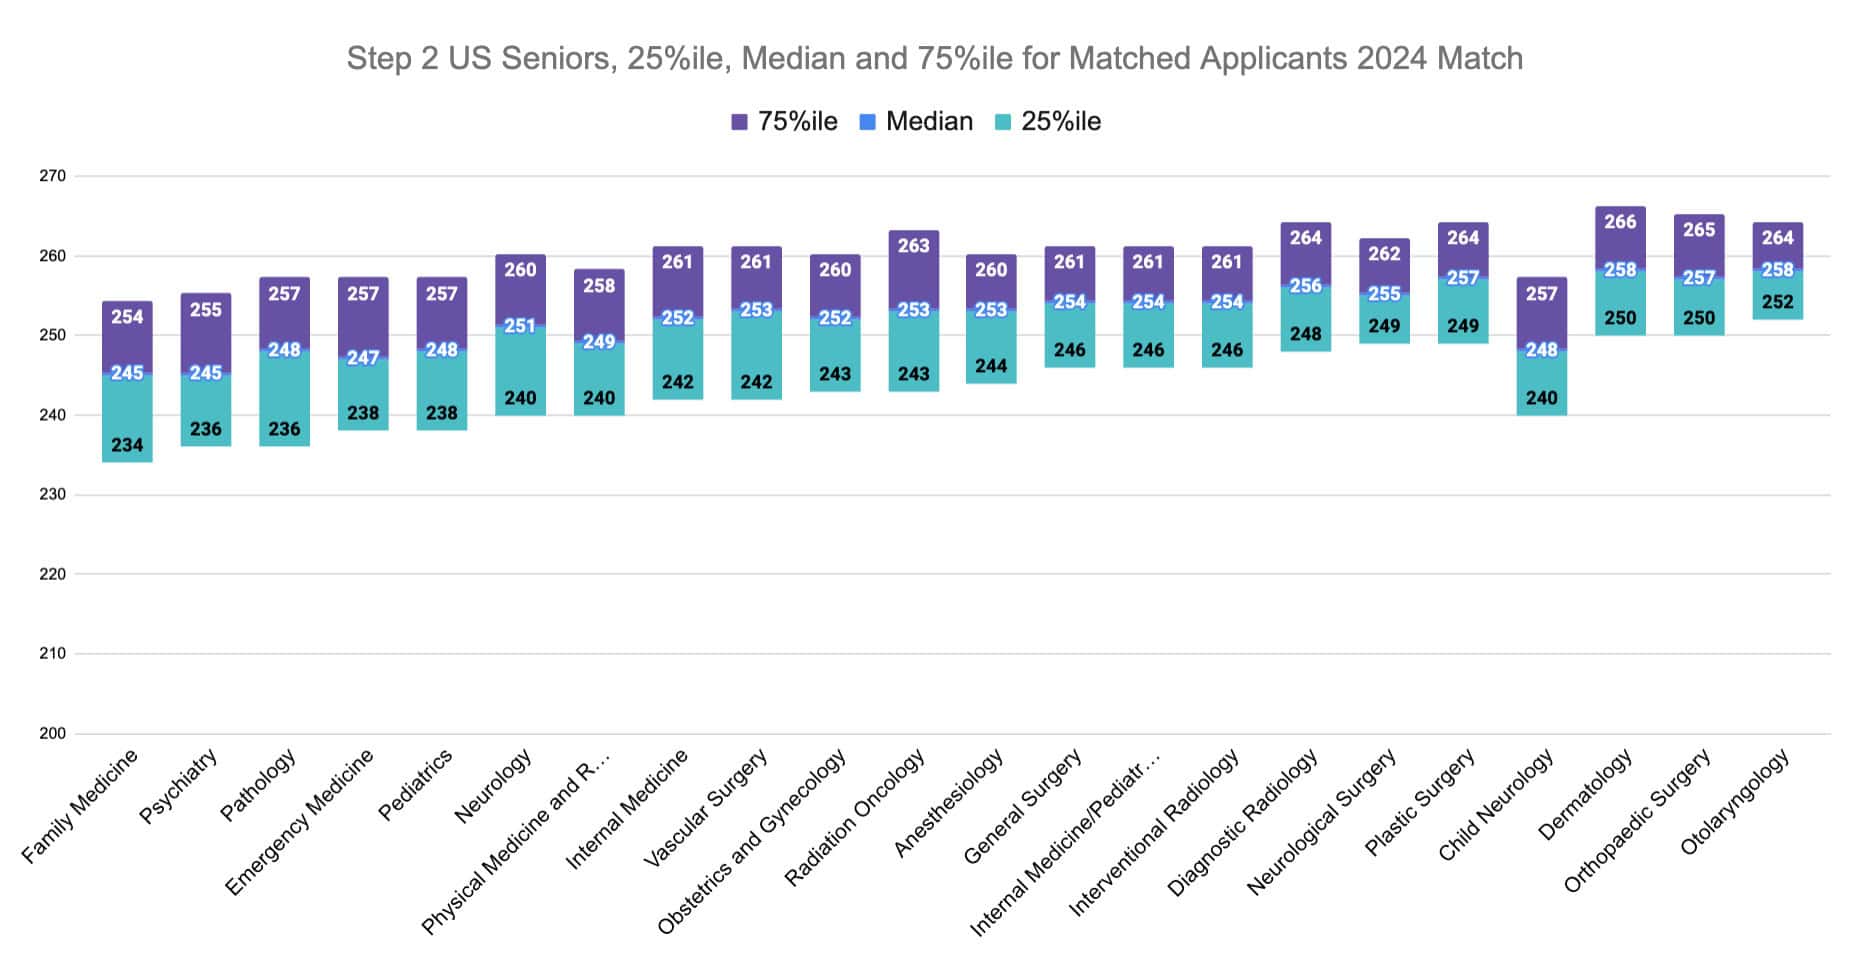
Residency Competitiveness by USMLE Step 2 CK Score
Another way to visualize the competitiveness of NRMP specialties is to look at the USMLE scores of successful applicants. Since there are few tools to make apples-to-apples comparisons across aspirants, USMLE scores are a common differentiator.
Here are the 25%ile, median, and 75%ile Step 1 scores for matched US Senior applicants by specialty in the 2024 Match.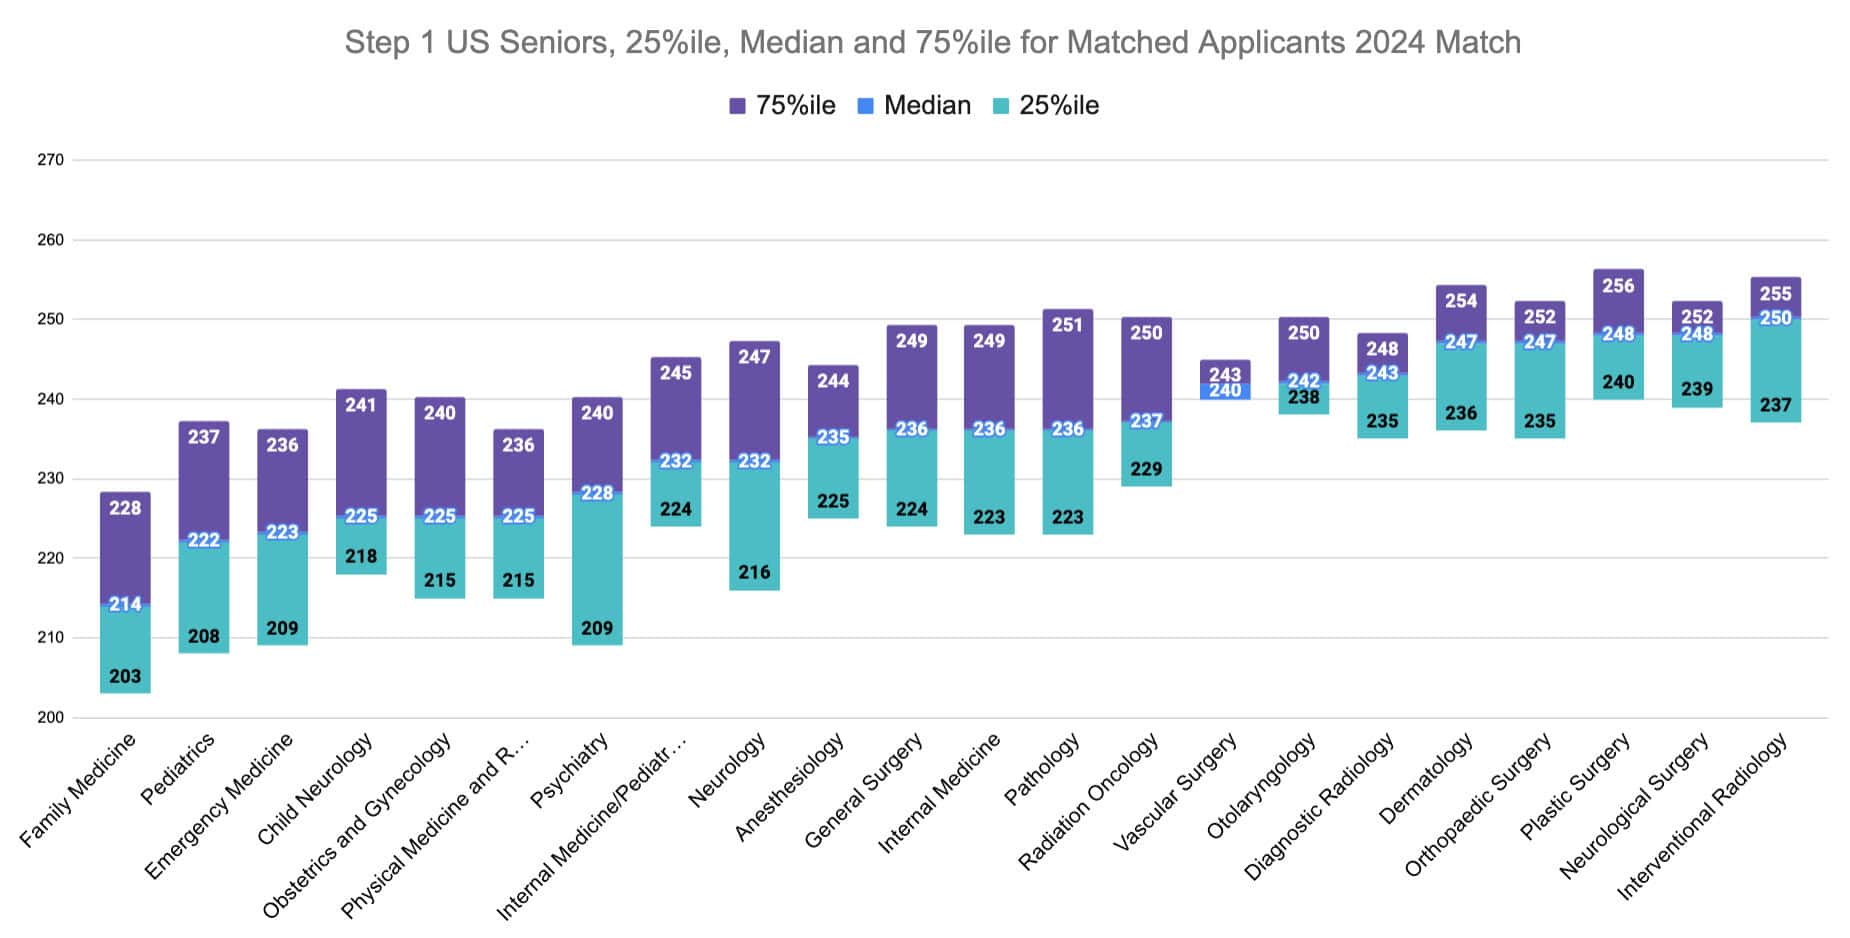
 NRMP Residency Competitiveness by Tier
From the above data, we can create three approximate tiers of competitiveness. They would be something like:
Brutally Competitive
- Neurological Surgery (31.3% unmatched)
- Dermatology (29.5%)
- Orthopedic Surgery (26.9%)
- Plastic Surgery (25.7%)
- Otolaryngology (18.1%)
- General Surgery (18.2%)
- Interventional Radiology (17.2%)
Competitive
- Physical medicine and rehabilitation(15.2%)
- Anesthesiology (14.8%)
- Obstetrics and Gynecology (14.3%)
- Internal medicine/pediatrics (14%)
- Diagnostic radiology (13.6%)
- Vascular Surgery (11.5%)
- Psychiatry (10.9%)
And finally,
Less Competitive
- Pathology (6.5%)
- Neurology (6.3%)
- Child neurology (2.9%)
- Radiation oncology(2.5%)
- Internal Medicine (2.2%)
- Emergency Medicine (2%)
- Family Medicine (1.2%)
- Pediatrics(0.4%)
Some Notable Surprises
A few names jumped out when scanning through the unmatched % list.
Are Radiation Oncology and Family Medicine equally less competitive?
Probably not? For example, median USMLE scores are significantly higher for radiation oncology. But it’s surprising that fewer US seniors successfully matched into family medicine than radiation oncology.
Psychiatry, PM&R Ob-Gyn Continue to Rise the Ranks
A recent trend is that psychiatry, physical medicine and rehabilitation, and obstetrics & gynecology are considered more competitive. The data support this observation, although psychiatry and PM&R-matched applicants tend to have lower USMLE scores. (The obvious argument is…how well will your USMLE score predict your abilities as a psychiatrist/physiatrist?)
The Elephant in the Room: Lifestyle
The obvious question behind residency competitiveness is, of course, WHY are some specialties more competitive than others? Yes, some specialties have fewer spots than others, limiting how many people can enter. And yes, no doubt there is a personal affinity towards each specialty.
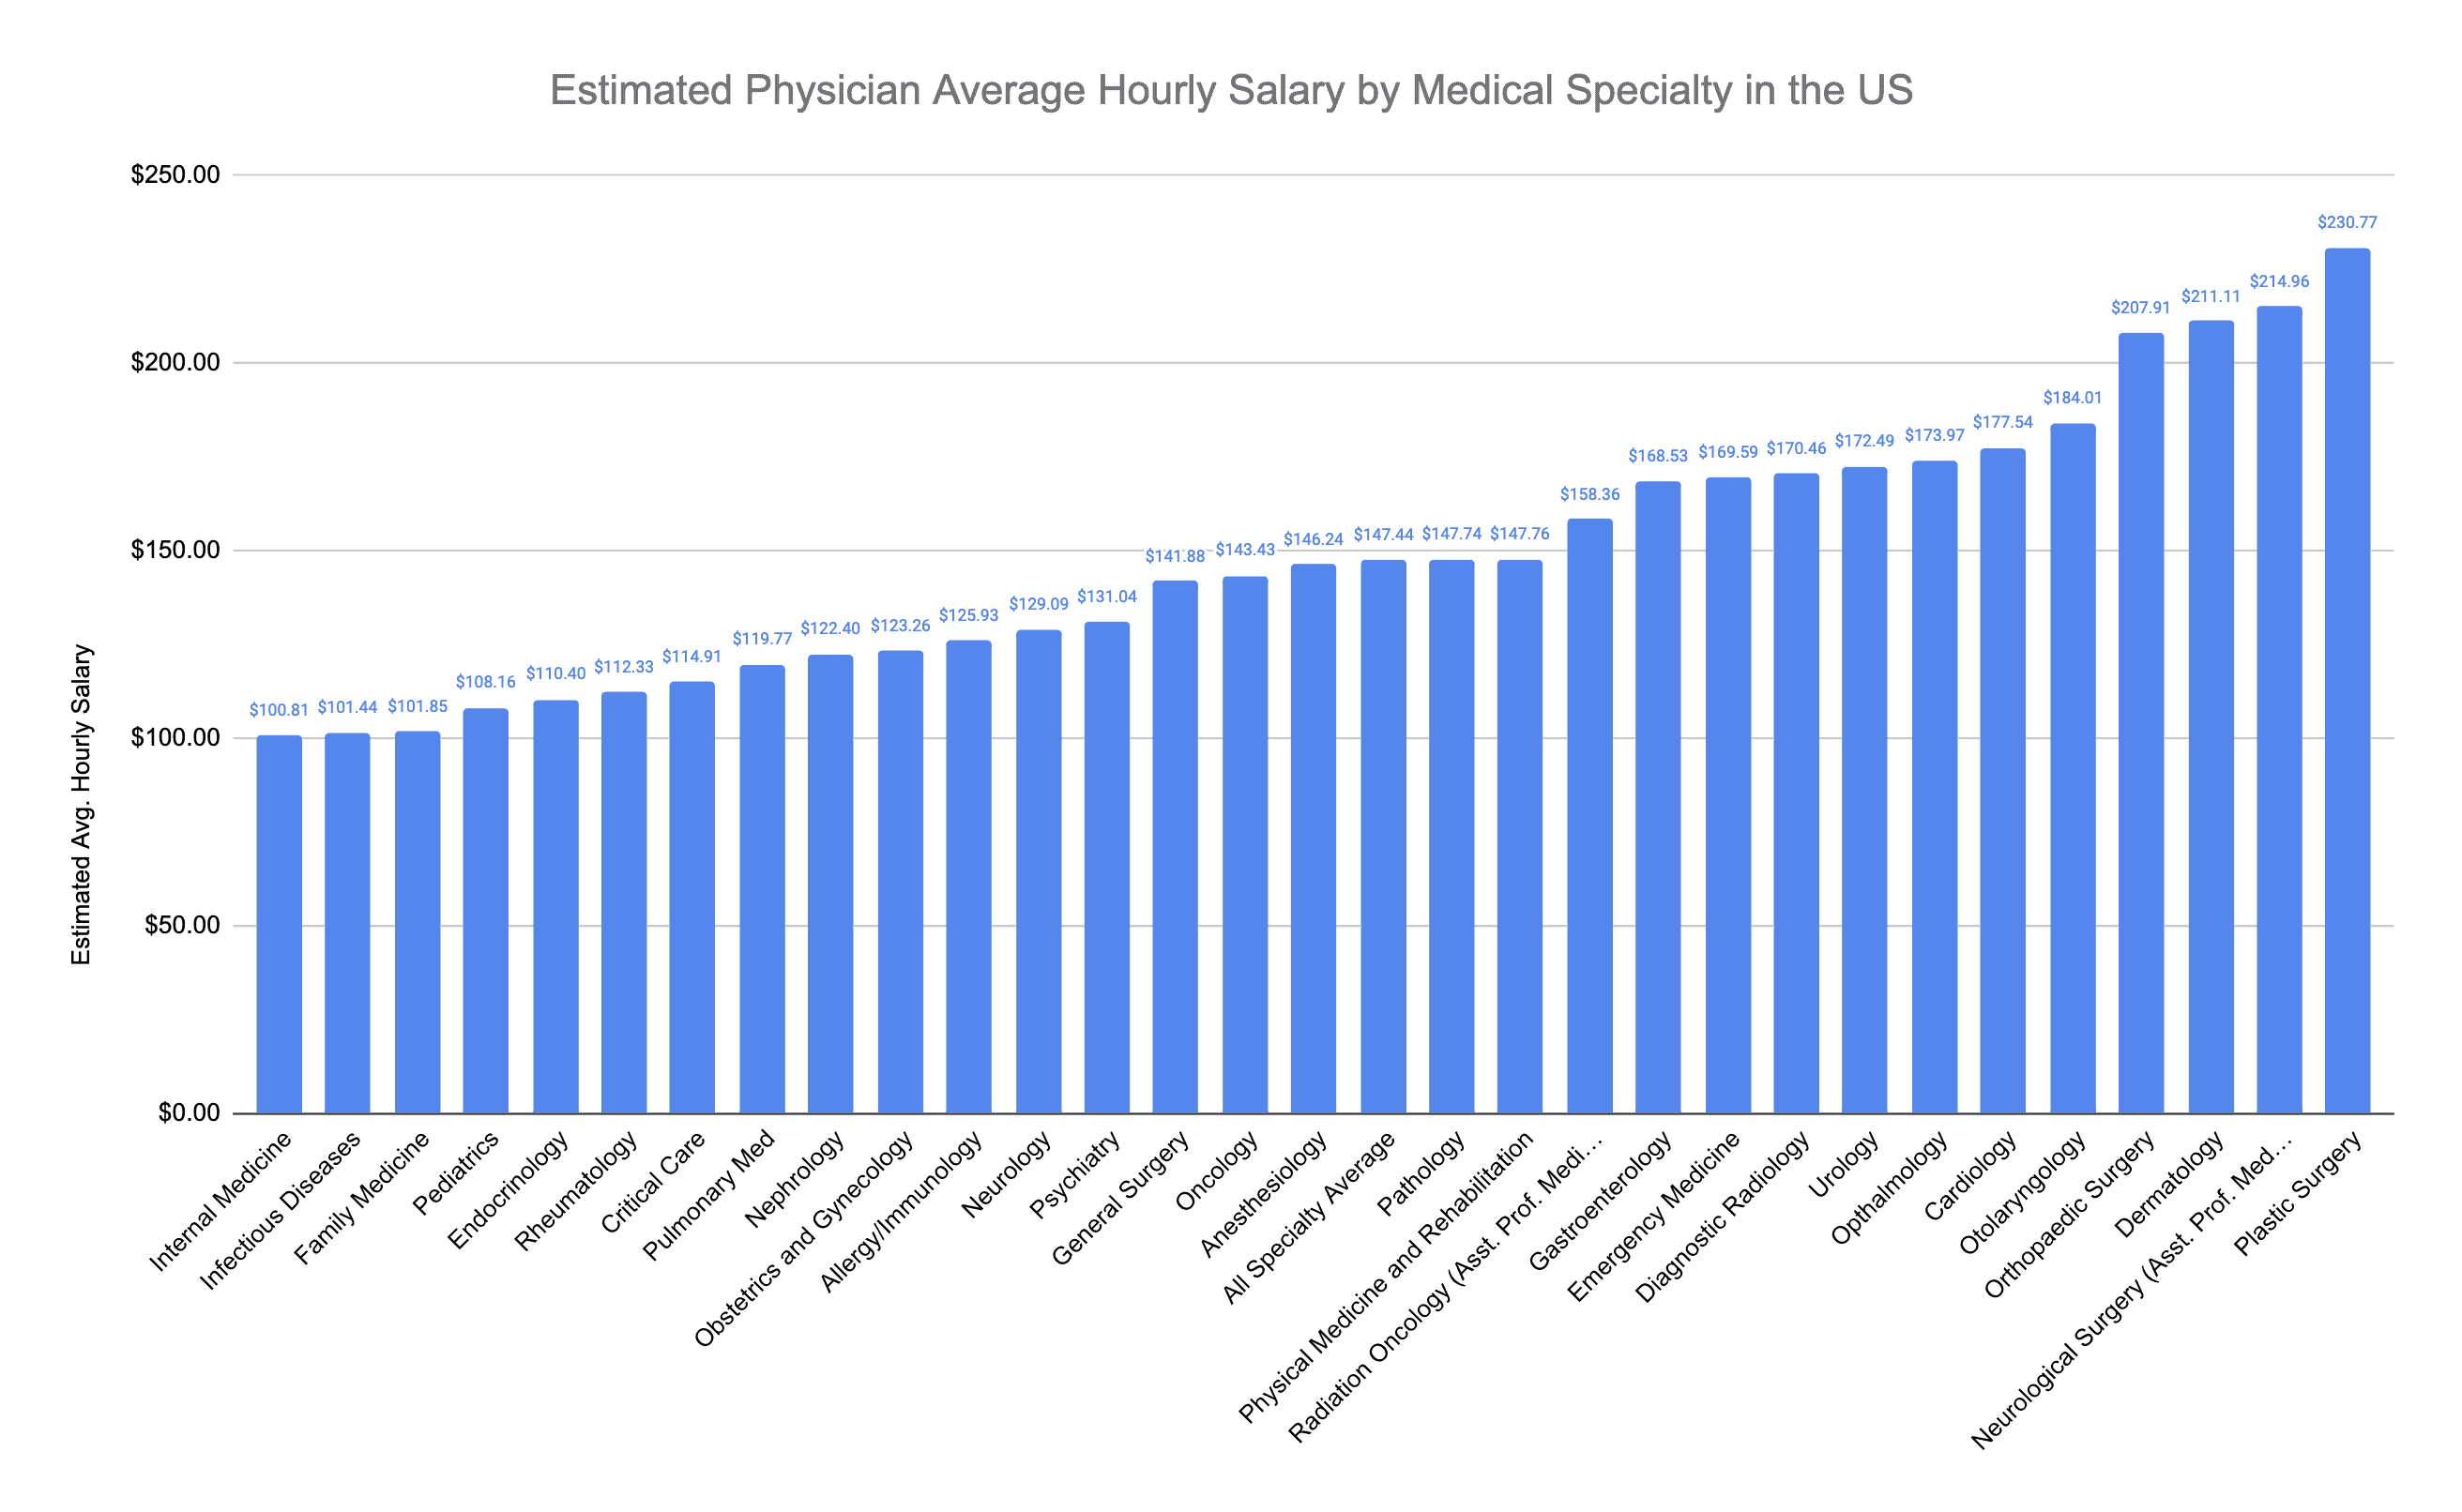
However, it would be foolish to overlook lifestyle as a significant factor determining residency competitiveness. Let’s look at the approximate hourly salary of each specialty.
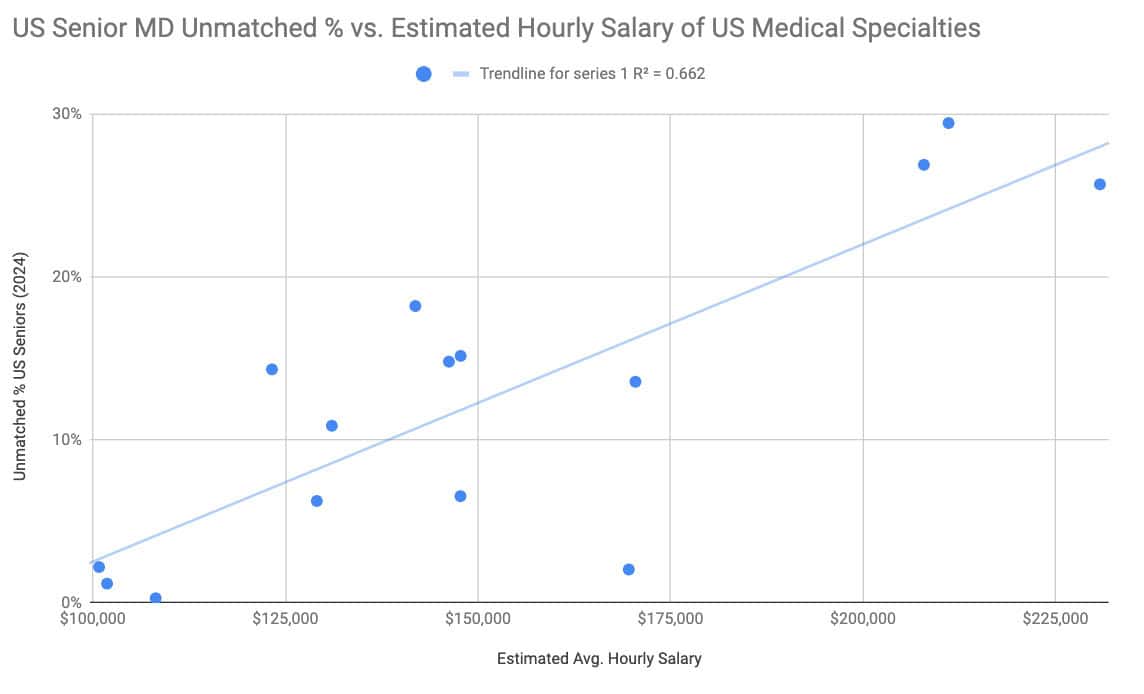
What do you notice? As discussed before, there is a robust correlation between hourly salary and specialty competitiveness.
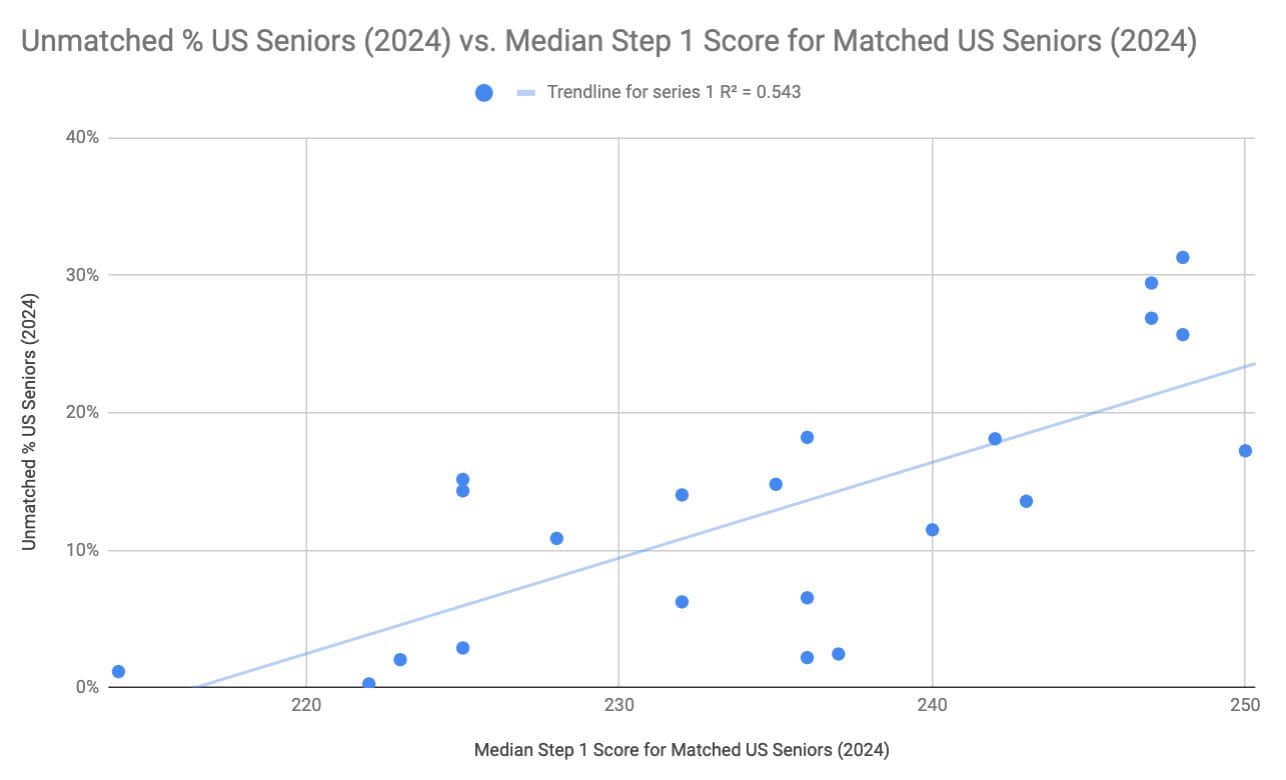
If we graph hourly salary vs. unmatched % by specialty, we see an even stronger correlation than the link between unmatched % and median Step 1 scores.
 Concluding Thoughts
We’ve just presented some sobering statistics on the competitiveness of certain specialties. If you’re interested in one of those specialties, you may swing between inspiration and dread.
On the other hand, what if you’re interested in one of the “less competitive” specialties noted above? Do the lower hourly salary, and median USMLE scores mean you’re somehow “lesser”?
Of course not! Quite frankly, some of the most inspiring doctors you’ll meet are in the “less competitive” specialties. The suspicion here is that a more significant percentage of those physicians are in it for the “right reasons.”
One final thing they told us at Stanford. Just because a specialty on aggregate may be less competitive doesn’t mean that every hospital is less competitive. In particular, the most desirable residencies in each specialty would be considered, “insanely competitive.” And this was coming from the head advisor at Stanford, who no doubt is still singing a similar tune.
What do you think? Does unmatched % or median USMLE scores not accurately represent a specialty’s competitiveness? Would you use a different metric? Or chuck the whole thing? Let us know in the comments!

 NRMP Residency Competitiveness by Tier
 Concluding Thoughts


